During the year, we reviewed our strategic asset allocation (SAA). We changed the optimal weight targets to 75%, 17.5% and 7.5% for fixed income, equities, and real estate, respectively. This suggests an overall modest risk profile. The asset mix as of 30 June 2022, is depicted in Table 4 below:
| No. | Asset Class | Allocation | Performance | Sharpe Ratio |
|---|---|---|---|---|
|
1 |
Equities |
15.30% |
-2.60% |
1.45 |
|
2 |
Real Estate |
7.40% |
4.56% |
0.11 |
|
3 |
Fixed Income |
77.30% |
15.11% |
61.29 |
|
|
Total portfolio |
100% |
11.62% |
6.17 |
Source: Internal
Essentially, the investment mix has been predominantly skewed towards fixed income. There have been deliberate efforts to diversify the investment portfolio since 2011. This has resulted in more allocation to equities and a reduction in real estate allocation. This is mainly attributed to the slow absorption of funds into projects caused by a rather bureaucratic process of procurement and contract management.
Nonetheless, we believe that having a moderate risk profile for the asset allocation is reasonable for several reasons:
The asset mix trend over the last nine years is depicted in Figure 4 below.
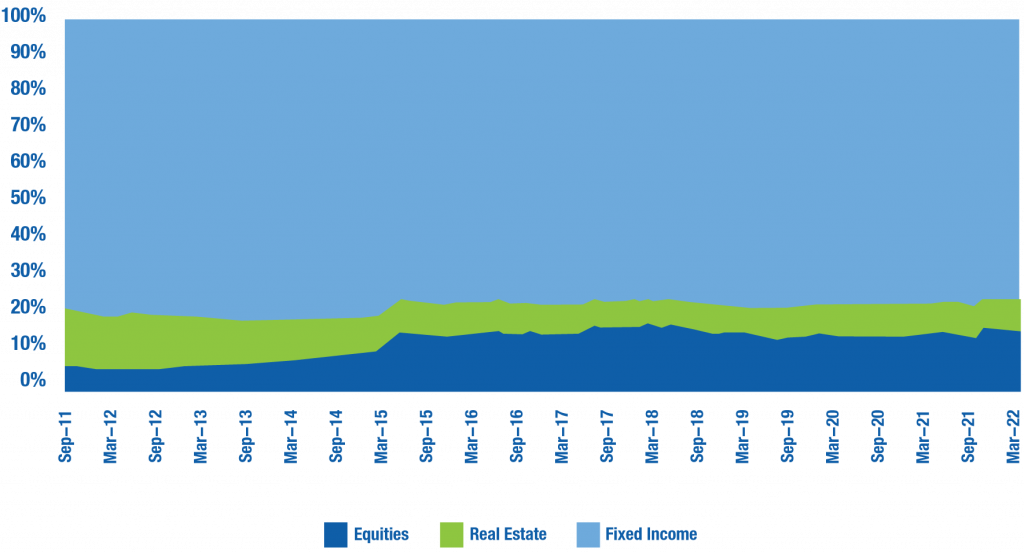
The asset mix trend over the last nine years is depicted in Figure 4 alongside.
Essentially, the investment mix has been predominantly skewed towards fixed income. There have been deliberate efforts to diversify the investment portfolio since 2011. This has resulted in more allocation to equities and a reduction in real estate allocation. This is mainly attributed to the slow absorption of funds into projects caused by a rather bureaucratic process of procurement and contract management.
Nonetheless, we believe that having a moderate risk profile for the asset allocation is reasonable for several reasons:
The investment portfolio is mainly exposed to six risk factors as depicted below. The exposure to these risk factors has largely stayed the same if you observe the periods of 30 June 2021, and 30 June2022.
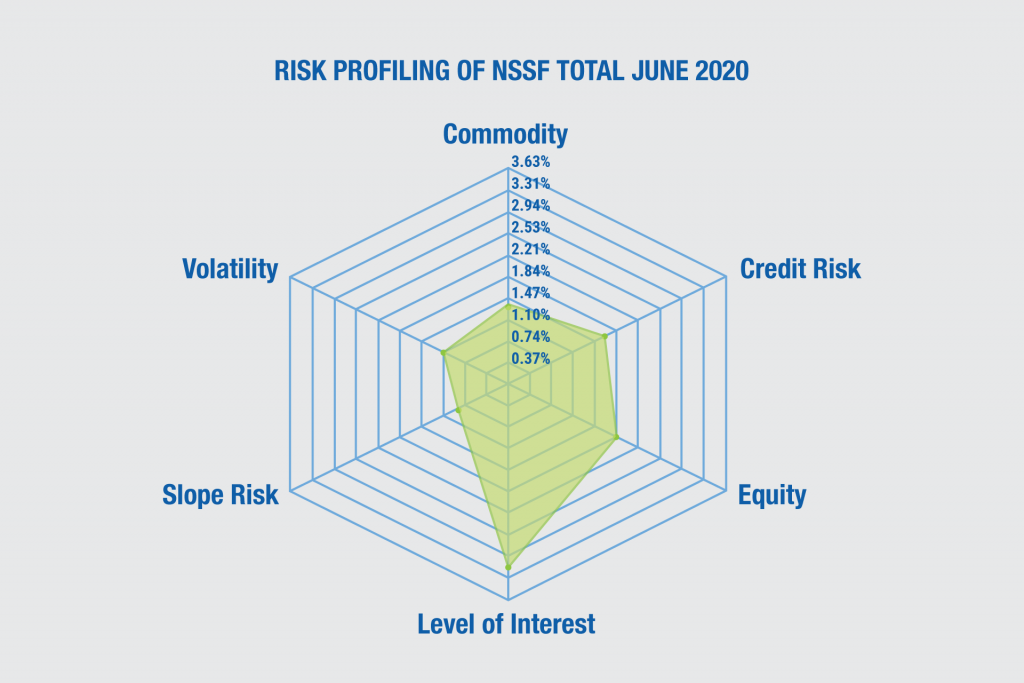

The biggest exposure of the portfolio is the level of interest rates. This is consistent with the large allocation to fixed income and investments in interest rate-sensitive stocks like financial services companies, mainly banks. The other key risk factors are market volatility, company-specific factors and credit risk. Equities explain most of the volatility of the portfolio occasioned by the change in prices on the stock exchanges. Uganda being a frontier market, also explains the existence of commodity and credit risk as key risk factors for the portfolio.
The fixed income portfolio stood at 77.3% of total assets while the equity and real estate portfolios stood at 15.3% and 7.4% respectively. Compared to one year ago, the allocations to fixed income and real estate largely remained flat. These allocations are consistent with the Fund’s preferred strategic exposures as per the SAA limits in Table 6 below.
| Asset Class | Jun-20 | Sep-20 | Dec-20 | Mar-21 | Jun-21 | Sep-21 | Dec-21 | Mar-22 | Jun-22 | SAA |
|---|---|---|---|---|---|---|---|---|---|---|
|
Fixed Income |
79.03% |
78.62% |
78.83% |
78.61% |
77.62% |
78.09% |
76.49% |
76.94% |
77.30% |
75.00% |
|
Equity |
13.69% |
13.80% |
13.75% |
13.97% |
14.82% |
14.36% |
16.08% |
15.53% |
15.30% |
17.50% |
|
Real Estate |
7.28% |
7.58% |
7.42% |
7.42% |
7.56% |
7.55% |
7.43% |
7.53% |
7.40% |
7.50% |
|
Total |
100% |
100% |
100% |
100% |
100% |
100% |
100% |
100% |
100% |
100% |
Source: Internal
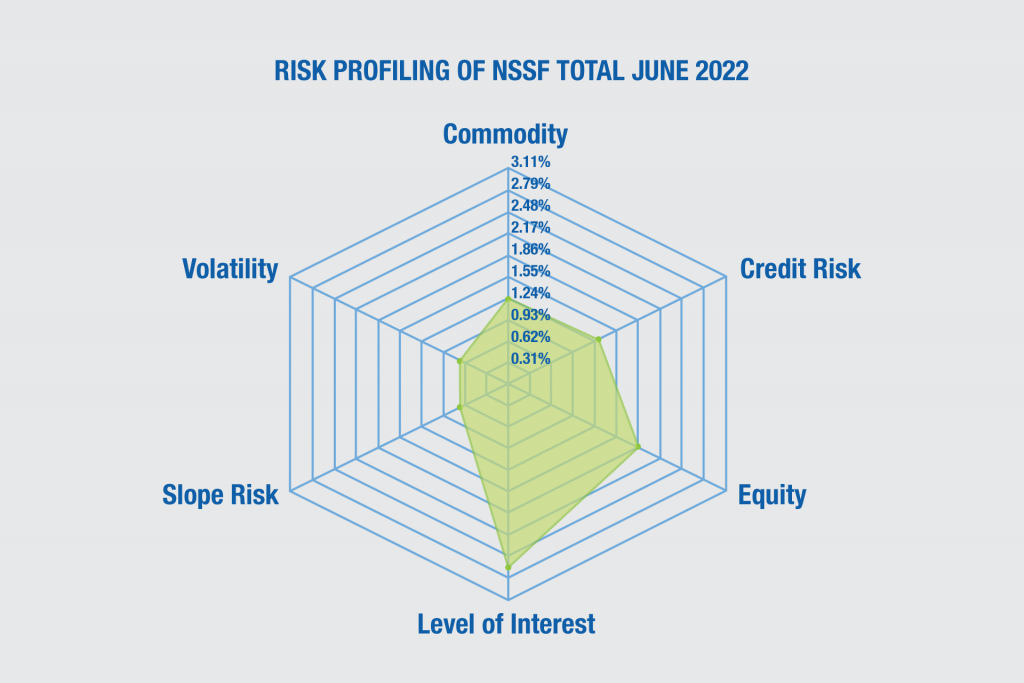
The investment portfolio is mainly exposed to six risk factors as depicted below. The exposure to these risk factors has largely stayed the same if you observe the periods of 30 June 2021, and 30 June2022.
The biggest exposure of the portfolio is the level of interest rates. This is consistent with the large allocation to fixed income and investments in interest rate-sensitive stocks like financial services companies, mainly banks. The other key risk factors are market volatility, company-specific factors and credit risk. Equities explain most of the volatility of the portfolio occasioned by the change in prices on the stock exchanges. Uganda being a frontier market, also explains the existence of commodity and credit risk as key risk factors for the portfolio.
The fixed income portfolio stood at 77.3% of total assets while the equity and real estate portfolios stood at 15.3% and 7.4% respectively. Compared to one year ago, the allocations to fixed income and real estate largely remained flat. These allocations are consistent with the Fund’s preferred strategic exposures as per the SAA limits in Table 6 below.
| Asset Class | Jun-20 | Sep-20 | Dec-20 | Mar-21 | Jun-21 | Sep-21 | Dec-21 | Mar-22 | Jun-22 | SAA |
|---|---|---|---|---|---|---|---|---|---|---|
|
Fixed Income |
79.03% |
78.62% |
78.83% |
78.61% |
77.62% |
78.09% |
76.49% |
76.94% |
77.30% |
75.00% |
|
Equity |
13.69% |
13.80% |
13.75% |
13.97% |
14.82% |
14.36% |
16.08% |
15.53% |
15.30% |
17.50% |
|
Real Estate |
7.28% |
7.58% |
7.42% |
7.42% |
7.56% |
7.55% |
7.43% |
7.53% |
7.40% |
7.50% |
|
Total |
100% |
100% |
100% |
100% |
100% |
100% |
100% |
100% |
100% |
100% |
Source: Internal
We continued to take advantage of opportunities in the fixed income markets in both Uganda and the region, albeit in a constrained way. The fixed income asset class recorded a return of 15.11%, a decrease from 16.00% recorded the previous year. Table 7 below illustrates the movement in the regional yield curves.
| Uganda | Kenya | Tanzania | |||||||
|---|---|---|---|---|---|---|---|---|---|
|
Tenor |
Jun-22 |
Jun-21 |
Change |
Jun-22 |
Jun-21 |
Change |
Jun-22 |
Jun-21 |
Change |
|
91 days |
7.87 |
6.9 |
0.14 |
8.10 |
6.86 |
0.18 |
2.65 |
3.30 |
-0.20 |
|
182 days |
9.01 |
8.92 |
0.01 |
9.20 |
7.32 |
0.26 |
2.56 |
3.57 |
-0.28 |
|
369 days |
11.06 |
9.84 |
0.12 |
9.99 |
7.73 |
0.29 |
4.73 |
5.03 |
-0.06 |
|
2 years |
13.71 |
11.17 |
0.23 |
11.56 |
9.43 |
0.23 |
4.40 |
7.89 |
-0.44 |
|
5 years |
15.02 |
13.28 |
0.13 |
12.29 |
11.12 |
0.11 |
8.94 |
9.10 |
-0.02 |
|
7 years |
15.28 |
13.53 |
0.13 |
13.00 |
11.85 |
0.10 |
9.33 |
10.14 |
-0.08 |
|
10 years |
15.60 |
13.93 |
0.12 |
13.59 |
12.26 |
0.11 |
10.34 |
11.60 |
-0.11 |
|
15 years |
16.19 |
14.36 |
0.13 |
13.88 |
12.88 |
0.08 |
11.27 |
13.61 |
-0.17 |
|
20 years |
17.63 |
15.33 |
0.15 |
13.92 |
13.27 |
0.05 |
12.01 |
15.41 |
-0.22 |
|
25 years |
|
|
|
13.94 |
13.53 |
0.03 |
12.36 |
16.34 |
-0.24 |
Source: Internal
There was an upward shift in the yields at the long end of the curves in Uganda and Kenya but we invested less in the second half of the year than if we had had more liquidity. Consequently, the improvement in yields did not significantly improve our income. Moreover, yields in Tanzania declined significantly over the year. Nonetheless, the Fund mainly invests in the long-end segment of the yield curve to match the duration of its member fund.
During the year ended 30 June 2022, the equity portfolio generated a return of -2.60%. The USE Local share index lost 21.1% to close at 271.
We attribute this decline to price declines across the board for all counters except for UMEME which was up 27.5% following an attractive dividend of UGX 54.1 per share. Other counters declined due to profit-taking retail investors and macro pressures coming into play namely: inflation, regional elections, and global geopolitics. Notable losers were BAT (50%), Stanbic Bank (12%) and Cipla (22%).
The USE All Share Index had a more aggressive decline (12.7%) due to cross-listed counters like EABL (18.8%), Equity Bank (21.7%) and KCB (14.6%) posting significant declines as Kenya drew closer to its elections. In Kenya, we witnessed foreign investor exits that have been exacerbated by Kenya’s debt pressures, global geopolitics, and quantitative tightening in the developed world.

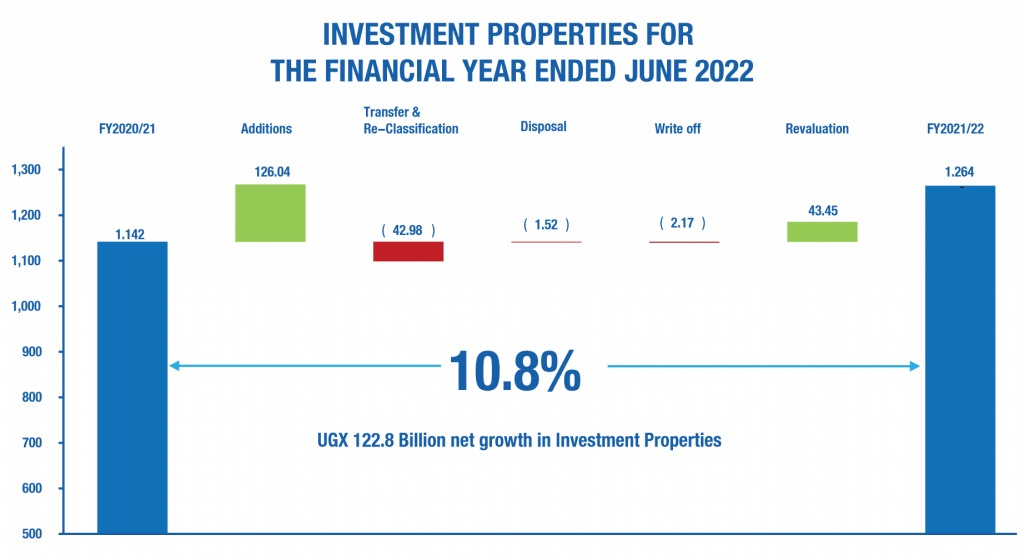
The illustration above shows the build-up of the investment properties for the financial year ended 30 June 2022.
We hold real estate assets to realise capital gains and earn income. Over 70% of this asset class comprises undeveloped land.
The strategy is to continuously work towards unlocking the value of some of the prime land through either, commercial developments for rent or the sale of residential units.
The entire real estate portfolio (including non-income generating assets) yielded 4.56% during the financial year to June 2022 which is the same that was recorded last year.
This return is mainly attributed to capital gains, sale of residential housing units and disposal of land.
During the year ended 30 June 2022, the equity portfolio generated a return of -2.60%. The USE Local share index lost 21.1% to close at 271.
We attribute this decline to price declines across the board for all counters except for UMEME which was up 27.5% following an attractive dividend of UGX 54.1 per share. Other counters declined due to profit-taking retail investors and macro pressures coming into play namely: inflation, regional elections, and global geopolitics. Notable losers were BAT (50%), Stanbic Bank (12%) and Cipla (22%).
The USE All Share Index had a more aggressive decline (12.7%) due to cross-listed counters like EABL (18.8%), Equity Bank (21.7%) and KCB (14.6%) posting significant declines as Kenya drew closer to its elections. In Kenya, we witnessed foreign investor exits that have been exacerbated by Kenya’s debt pressures, global geopolitics, and quantitative tightening in the developed world.
The illustration above shows the build-up of the investment properties for the financial year ended 30 June 2022.
We hold real estate assets to realise capital gains and earn income. Over 70% of this asset class comprises undeveloped land.
The strategy is to continuously work towards unlocking the value of some of the prime land through either, commercial developments for rent or the sale of residential units.
The entire real estate portfolio (including non-income generating assets) yielded 4.56% during the financial year to June 2022 which is the same that was recorded last year.
This return is mainly attributed to capital gains, sale of residential housing units and disposal of land.
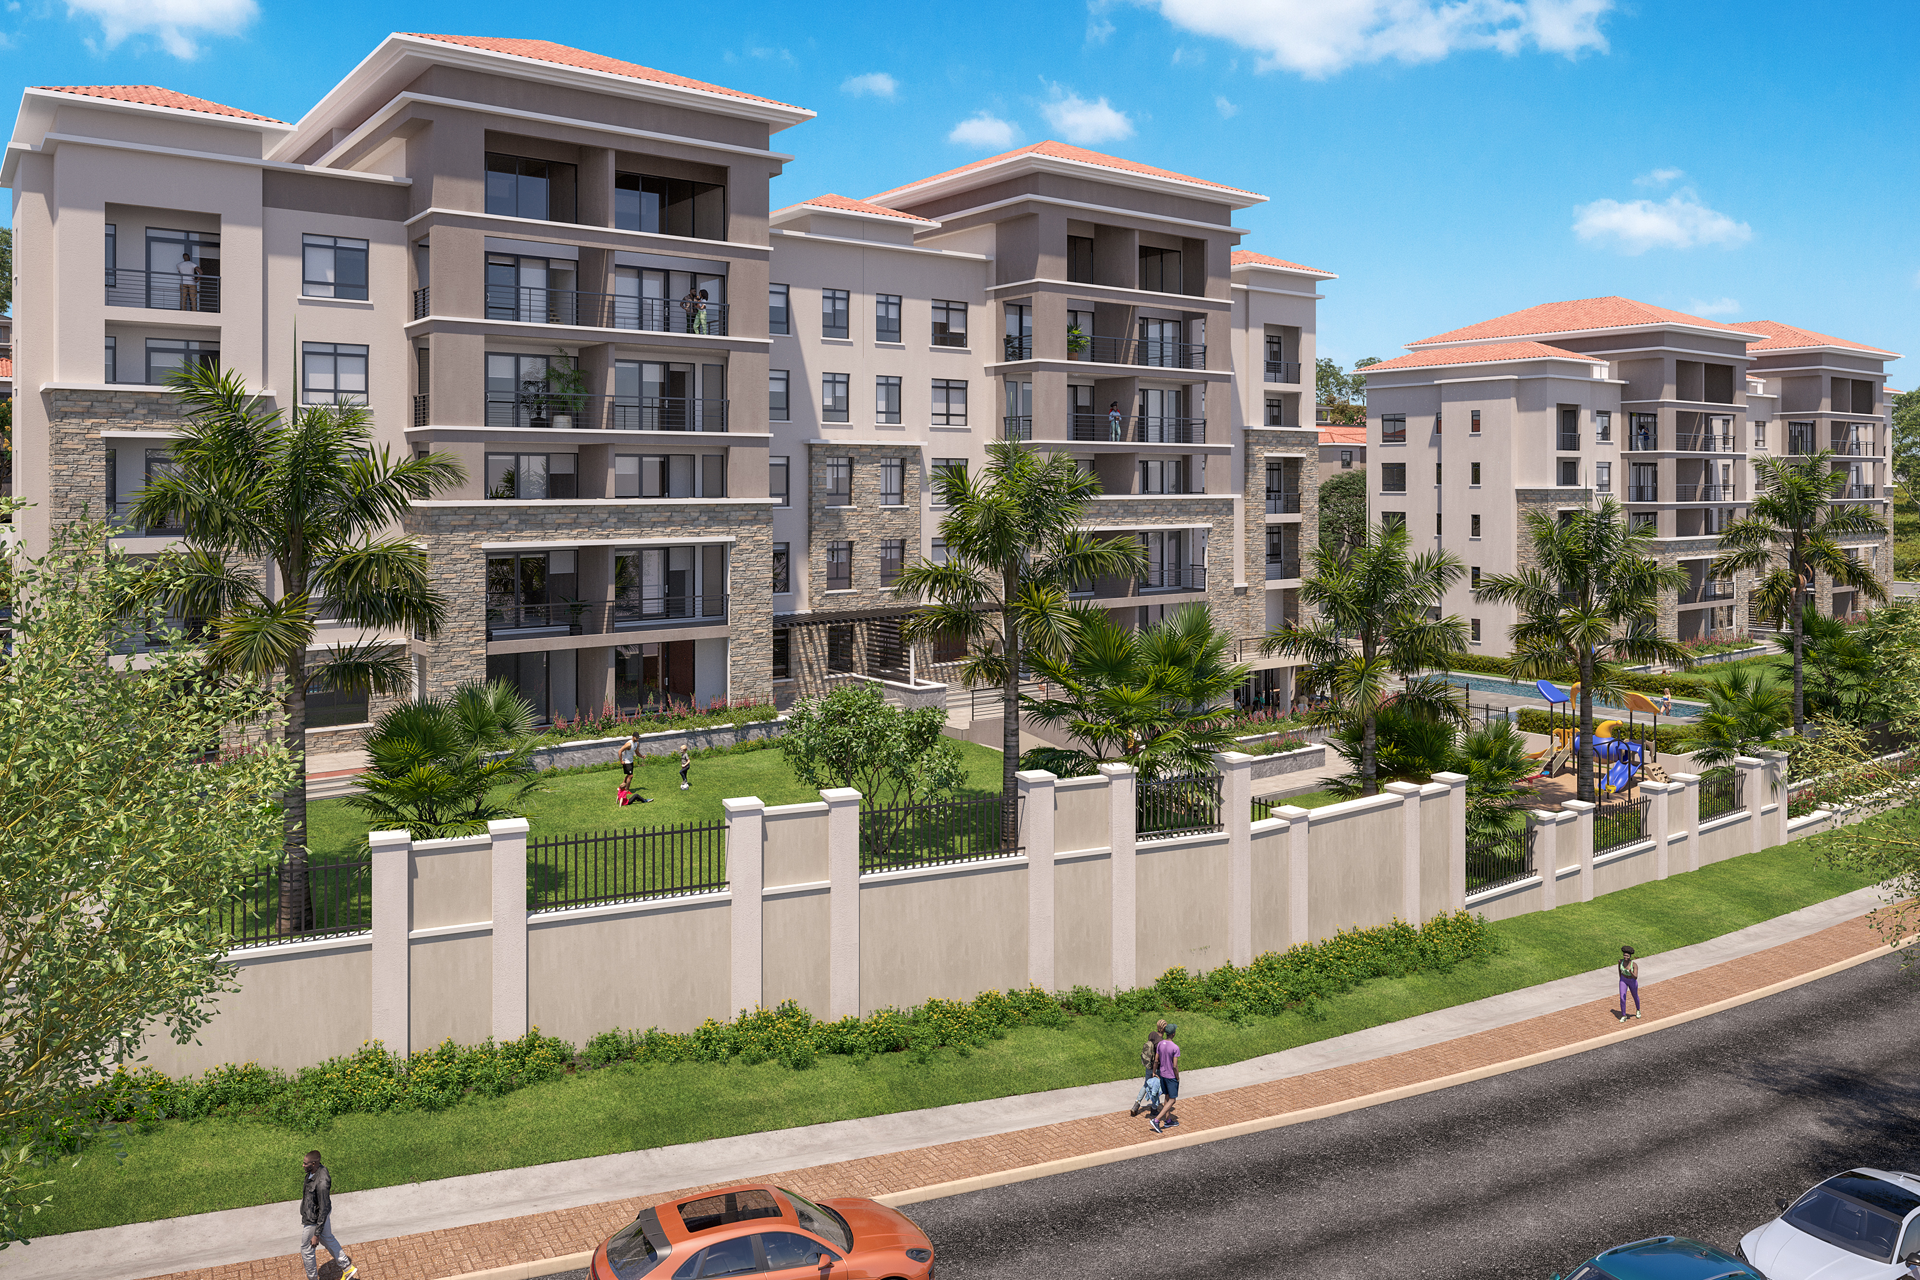
The Lubowa Housing Project is conceptualised as a self-sustaining satellite city with mixed-use housing and commercial developments on approximately 600 acres. The project is intended as a phased development with construction starting with an initial 306 housing units on 78 acres. Phase 1 will comprise of four (4) distinct house types: Apartments, Bungalows, Townhouses, and Villas.
Construction works for all house types are ongoing and as of 30 June 30, 2022, the progress was estimated at 96%.


Pension Towers is conceptualised as an intelligent and modern commercial complex comprising 3 Towers (up to a max height of 32 floors) all sitting on 4 No. basement floors of parking. The total built-up area will be approximately 75,000m2 that will house office and retail space. The project has frontage on both Lumumba Avenue and Nakasero Road.
Construction works are ongoing and as of 30 June 2022, the progress was estimated at 80%.
The Temangalo Housing Project is conceptualized as a self-sustaining satellite city with mixed-use affordable housing and commercial developments on approximately 463 acres.
The project will comprise of 3,500 homes with attendant retail and commercial amenities. During the fiscal year, the master plan was finalized and approved, and construction works of phase 1 (which has 550 units, ten different house types) commenced.
The progress achieved in the fiscal year was 20%.


The Lubowa Housing Project is conceptualised as a self-sustaining satellite city with mixed-use housing and commercial developments on approximately 600 acres. The project is intended as a phased development with construction starting with an initial 306 housing units on 78 acres. Phase 1 will comprise of four (4) distinct house types: Apartments, Bungalows, Townhouses, and Villas.
Construction works for all house types are ongoing and as of 30 June 30, 2022, the progress was estimated at 96%.
Pension Towers is conceptualised as an intelligent and modern commercial complex comprising 3 Towers (up to a max height of 32 floors) all sitting on 4 No. basement floors of parking. The total built-up area will be approximately 75,000m2 that will house office and retail space. The project has frontage on both Lumumba Avenue and Nakasero Road.
Construction works are ongoing and as of 30 June 2022, the progress was estimated at 80%.
The Temangalo Housing Project is conceptualized as a self-sustaining satellite city with mixed-use affordable housing and commercial developments on approximately 463 acres.
The project will comprise of 3,500 homes with attendant retail and commercial amenities. During the fiscal year, the master plan was finalized and approved, and construction works of phase 1 (which has 550 units, ten different house types) commenced.
The progress achieved in the fiscal year was 20%.
We intend to continue with portfolio rebalancing. For the fixed income asset class, this will be done by exploring corporate bonds and structured product opportunities. We will also continue to seek more diversification opportunities within Uganda and the East African region.
In the equity asset class, we will explore opportunities in all the markets where we invest. Private equity also remains high on our radar.
In the real estate asset class, the strategy is to continuously work towards unlocking the value of some of the prime land through either undertaking commercial and mixed-use developments for renting out or building residential houses for sale. 70% of the real estate class comprises undeveloped land.
Developing the land is one of the ways of unlocking the accumulated value over time.